
|
|
Variety In Mathematics Lessons Click on the image to buy from www.atm.org.uk. “All teachers, from trainees to those with
years of experience, will find ideas here that will add variety and interest
for them and for their pupils. Every maths department should own a copy and
every maths teacher should use it.” “A fascinating and challenging set of ideas ... it would be
impossible to read the book and not find something new on every page ... this book is a real gem and cannot fail to help develop
our teaching.” "A valuable
resource for all teachers." |
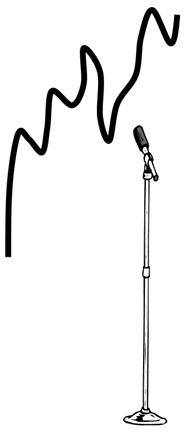
Singing Graphs! (see page 16)
|
SoundFunction
|
Many learners will be familiar with experiencing a graph as a static image
or as a left-to-right developing line. (The impact of these alternatives can
be quite different.) Often these pictures are linked to tables of numbers. A
different non-visual
way of experiencing a graph might be as a sound, where the pitch relates to the
‘y-value’, while the ‘x-value’ operates as time. The program SoundFunction (available for free download below) enables the user to enter a list of numbers (perhaps pasting in a column of values from a spreadsheet) and the software generates the appropriate soundtrack. (Zero is taken as middle C and an increase of 1 unit corresponds to a semitone musically.)
Scroll down this page for some mp3 files produced by SoundFunction. Tasks learners might
work on with this program could include: · Predict what particular graphs would sound like and then try them out. · Identify graphs from their sounds as precisely as you can (see below for ready-made examples). · Which graphs sound ‘boring’/'predictable'? Why? · Which graphs sound 'surprising'? Why? · Which graphs are ‘soprano’/’bass’ graphs? Why? · Which graphs are in your singing range? Which would be hard to sing? Why? · When do you need 'perfect pitch' to identify a graph; when is 'relative pitch' enough? ·
What are the aural effects of transformations
such as It is also possible to use SoundFunction to represent sequences: ·
What do the square numbers ‘sound like’? ·
How could you tell the square numbers from the
cube numbers? ·
How does an arithmetic series sound different
from a geometric series? ·
What is the same and what is different about
the sounds of different arithmetic series? |

Identifying
Graphs
Listen to the sound files (mp3) below and try to identify which graphs (or kinds of graphs) they might represent:
Function 1
Function 2
Function 3
Function 4
Function 5
Function 6
Function 7
Function 8
Function 9
Function 10
Function 11
Function 12
Function 13
Function 14
Function 15
© Colin Foster 2007